One thing that can be a little surprising when you use minikube with the docker driver, is that it doesn’t actually use the images from your local docker when it runs. It actually runs with containerd.
Your kubernetes node is “running in your docker” (KIC / Kubernetes-in-Container), but that node uses containerd and its own registry when running pods itself.
Why are large images a problem?
When you go to use an image, you have to do this to move it from your docker registry to your minikube registry.
minikube image load appname:tagname 2>&1
This operation basically does a docker-image-save to a large tar file, copies that file into the container running your kubernetes, and unpacks it into containerd. This is very expensive on memory; it can freeze WSL2 (ubuntu) on my high end laptop on a 8GB image. If you are finding the image load command hangs your WSL, try opening two terminals and use htop to watch the memory usage as the command runs; you’ll see it soak up far more than you would expect, and then it likely starts swapping/etc and slowing everything down until it is unusable.
So… How do we use big images?
Building big images isn’t much of a problem as it happens in a more efficient way. So, the solution is to build directly into minkube instead of building into docker and importing to minikube.
Generally when you set up an ingress controller in a k8s cluster, it will be exposed as NodePort across all of your nodes and the related load balancer will go over all nodes in your cluster (round robin or whatever it is). This happens with NGINX/ALB/etc.
We have seen this cause various problems at scale over the years. Two good examples are…
(1) An ALB ingress will register every node for every rule, and you’ll hit your AWS Service Quota for # of targets to a LB (1000 default) quickly as your # of rules times your # of nodes scale.
(2) If your cluster auto-scales a lot, there is a non-trivial chance your LB will direct through a node which may scale down on the route to your actual ingress pod. The network path is User -> LB -> Any Cluster Node -> Ingress Pod -> Service -> Target Pod. In the past we have seen this drop traffic and e.g. interrupt a user communicating with Trino. We saw this in various cases; but it seems like proper node draining could avoid it; so I can’t confirm if it is still an issue at this point.
In any case, it is a *very* good idea to use your ingress controller’s config to target a specific set of nodes that are finite and don’t scale a lot via labels. We tend to make a “main” node group to hold ingress controllers, coredns, kube dashboard, and similar things for this.
We’ve been hosting a service for over a year now that basically deploys Apache Airflow over kubernetes in a SaaS model. Each internal client/user gets one instance of their own, including its own dedicated scheduler, web server, and general namespace to run task pods. Teams can run hundreds or thousands of parallel tasks each on their instance, all scheduled on the central cluster as an individual pod per task.
We use EKS v1.16 on AWS. One interesting problem we have run into is that Airflow can create a ton (tens of thousands) of short-lived/ephemeral pods, and they often have very low resource constraints. Often, they are very short-lived.
This can mean that a node with low CPU/memory usage may have hundreds or thousands of pods scheduled on it back-to-back as they keep creating/running/being cleaned at a rapid pace (which is very cool).
So, What is the Problem?
It turns out that, while CPU and memory can be very low on some nodes, the sheer act of creating/managing/destroying so many pods can cause issues in its own right. We use the prometheus operator in our Kubernetes, and it starts alerting us of KubeletPlegDurationHigh – The Kubelet Pod Lifecycle Event Generator has a 99th percentile duration of 10 seconds on node <node-id>.”
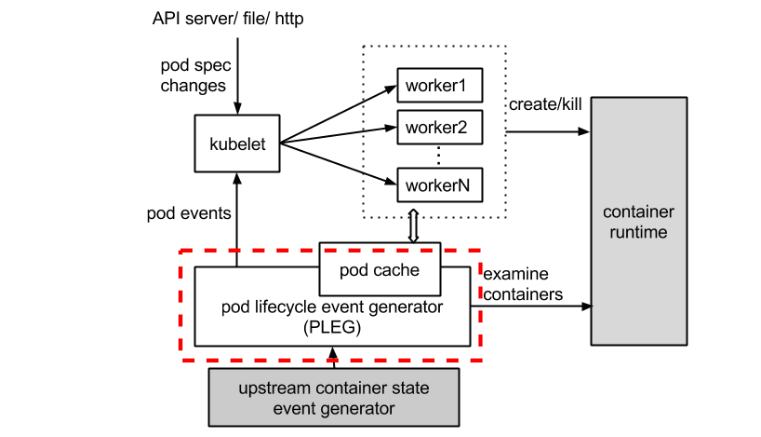
The PLEG module in kubelet (Kubernetes) adjusts the container runtime state with each matched pod-level event and keeps the pod cache up to date by applying changes.
Let’s take a look at the dotted red line below in the process image.
Assuming you have the prometheus operator installed and have the relevant metrics/alerts, here is a chart that lets you view the PLEG activity well in graphical form. This helps you understand if your solutions are helping much.
You don’t need the kubernetes_cluster spec, unless you’ve added that as an external label as well over multiple prometheuses (we query this from Thanos which aggregates multiple prometheus instances).
Here’s one of the queries in text form with that removed so you can copy paste easier:
There are numerous things you can do to help mitigate this issue:
Add more nodes to the cluster / increase minimum on auto scaler range. More nodes = more distribution of pods = less PLEG issues as they are on a per-node basis.
Monitor and find the threshold/count of pods where issues happen, then adjust the kubelet settings to it can’t have that many pods. Generally we only see PLEG issues when we pass 45 pods on a node *and* have lots of ephemeral pods. This will change based on instance type and workload I’m sure, but I’m sure you can spot a trend and set the minimum to help mitigate. This is a good solution as an explicit pod limit will make the CA scale up new nodes properly.
Distribute pods better around the cluster. Kubernetes, when running lots of ephemeral pods, tends to hot spot a bit and put more of these short lived pods on a few nodes that have less resources. You can use things like https://kubernetes.io/docs/concepts/workloads/pods/pod-topology-spread-constraints/ in newer kubernetes versions to reduce hot-spotting and mitigate PLEG issues (and other issues like docker rate limiting). This really just helps you use your existing servers more optimally.
I’m sure there are ‘better’ ways to fix this, but we haven’t found them yet. I’ll circle back and update this if and when we find them.
We use AWS EKS (v1.16) kubernetes for our auto scaling Presto deployments, and we and front it with an nginx ingress leveraging a network load balancer.
We found that, once we started auto scaling, we started getting remote disconnect errors from clients fairly frequently. This was pretty hard to explain because we had actually gone to great lengths to make sure Presto itself was gracefully terminating in a way that would not damage live queries.
Where is the Issue?
The root cause of this issue is that:
We use ingress.
Ingress uses a cloud load balancer.
The cloud load balancer talks to the nginx ingress controller as a NodePort service.
This means the LB will route traffic through any random node in the cluster.
So, we gracefully terminate presto, but the NodePort service on the node that is scaling down may still be used for routing traffic to another node (e.g. the coordinator in this case).
Other solutions are being developed now and will allow you to exclude certain nodes from the LB config using labels/etc, but they are not ready yet.
What is a Workaround?
Unfortunately, we did not solve this purely using the NGINX ingress. We found that we had to schedule the ingress services on some non-auto-scaling core nodes, and then we added them to the load balancer specifically (actually, to a separate LB we created and manage with terraform). This way, ingress always comes into nodes that do not auto scale, and those nodes route to the other services in a reliable way using the CNI black magic. It’s not a feel-good solution, but it remains stable during auto scaling of the rest of the cluster, so it works until a real k8s/AWS solution is developed.