If you’re having trouble getting the /ui/api/stats info programmatically, you can use this script. Its ill-advised as they may change those APIs at any time; but as some of the UI stats are better/more correct than prometheus stats, you may need them as we did.
If the dock at the bottom of your Mac is getting in your way when you try to do quick actions, like using a horizontal scroll-bar in a full-screen app, then you can use this CLI setting to bump up the delay to a few seconds.
I find 3 seconds is enough to get most things in that area of the screen done, but is also short enough that it using the dock on purpose isn’t too painful.
defaults write com.apple.Dock autohide-delay -float 3; killall Dock
In Amazon Web Services (AWS), you generally spread your nodes over multiple availability zones for high availability. Unfortunately, not every node type is available in every availability zone, and in general, it is hard to know which zones one is available in in advance.
Error Types
If you are provisioning a single EC2 instance or you are only provisioning EC2s in an Auto Scaling Group (ASG) in a single-zone, you will obviously notice if you chose an incompatible zone for your instance type as it just won’t work.
It can be more nefarious when you have an ASG with multiple zones though. For example, our large scale airflow service runs in kubernetes, and the main ASG goes over 3 zones. Today, we ran out of IPs in two zones and realized that the third was not even being utilized. When hunting down why, this message was in the “activity” tracker page for the ASG.
Launching a new EC2 instance. Status Reason: Your requested instance type (r5.2xlarge) is not supported in your requested Availability Zone (us-east-1e). Please retry your request by not specifying an Availability Zone or choosing us-east-1a, us-east-1b, us-east-1c, us-east-1d, us-east-1f. Launching EC2 instance failed.
This is a very helpful message, but it’s unfortunate that we had to do the wrong thing in order to get the supported zones list.
Getting the Correct Zones in Advance
You can use this AWS CLI (V2) command to check the list of zones supported for an instance type in advance.
We’ve been hosting a service for over a year now that basically deploys Apache Airflow over kubernetes in a SaaS model. Each internal client/user gets one instance of their own, including its own dedicated scheduler, web server, and general namespace to run task pods. Teams can run hundreds or thousands of parallel tasks each on their instance, all scheduled on the central cluster as an individual pod per task.
We use EKS v1.16 on AWS. One interesting problem we have run into is that Airflow can create a ton (tens of thousands) of short-lived/ephemeral pods, and they often have very low resource constraints. Often, they are very short-lived.
This can mean that a node with low CPU/memory usage may have hundreds or thousands of pods scheduled on it back-to-back as they keep creating/running/being cleaned at a rapid pace (which is very cool).
So, What is the Problem?
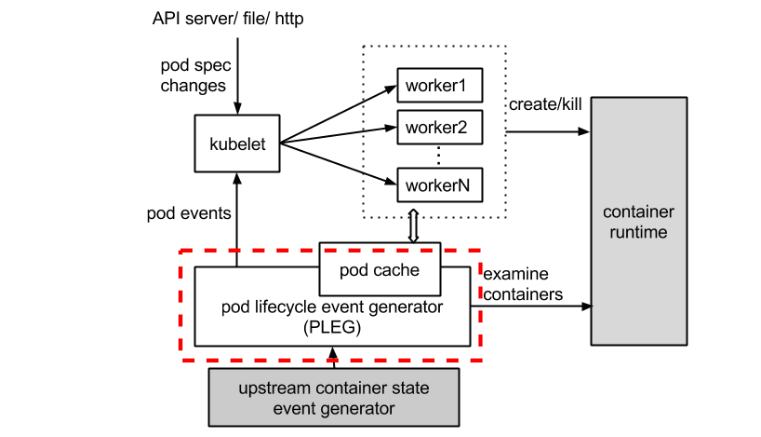
It turns out that, while CPU and memory can be very low on some nodes, the sheer act of creating/managing/destroying so many pods can cause issues in its own right. We use the prometheus operator in our Kubernetes, and it starts alerting us of KubeletPlegDurationHigh – The Kubelet Pod Lifecycle Event Generator has a 99th percentile duration of 10 seconds on node <node-id>.”
The PLEG module in kubelet (Kubernetes) adjusts the container runtime state with each matched pod-level event and keeps the pod cache up to date by applying changes.
Let’s take a look at the dotted red line below in the process image.
Assuming you have the prometheus operator installed and have the relevant metrics/alerts, here is a chart that lets you view the PLEG activity well in graphical form. This helps you understand if your solutions are helping much.
You don’t need the kubernetes_cluster spec, unless you’ve added that as an external label as well over multiple prometheuses (we query this from Thanos which aggregates multiple prometheus instances).
Here’s one of the queries in text form with that removed so you can copy paste easier:
There are numerous things you can do to help mitigate this issue:
Add more nodes to the cluster / increase minimum on auto scaler range. More nodes = more distribution of pods = less PLEG issues as they are on a per-node basis.
Monitor and find the threshold/count of pods where issues happen, then adjust the kubelet settings to it can’t have that many pods. Generally we only see PLEG issues when we pass 45 pods on a node *and* have lots of ephemeral pods. This will change based on instance type and workload I’m sure, but I’m sure you can spot a trend and set the minimum to help mitigate. This is a good solution as an explicit pod limit will make the CA scale up new nodes properly.
Distribute pods better around the cluster. Kubernetes, when running lots of ephemeral pods, tends to hot spot a bit and put more of these short lived pods on a few nodes that have less resources. You can use things like https://kubernetes.io/docs/concepts/workloads/pods/pod-topology-spread-constraints/ in newer kubernetes versions to reduce hot-spotting and mitigate PLEG issues (and other issues like docker rate limiting). This really just helps you use your existing servers more optimally.
I’m sure there are ‘better’ ways to fix this, but we haven’t found them yet. I’ll circle back and update this if and when we find them.